Well Comparison
Well Comparison
Overview
The Well Comparison feature allows users to analyze and compare data from multiple wells simultaneously. By selecting various wells and variables, users can generate visuals that display data trends and patterns across different wells, facilitating better comparative analysis and decision-making.
Key Features
- Multi-Well Analysis: Select multiple wells to compare data across different locations or time periods.
- Variable Selection: Choose multiple variables to be analyzed and displayed in the visualizations.
- Multiple Visuals: Generate one visual for each selected variable, displaying multiple lines representing data from each well.
- Normalized X-Axis Option: Standardize the x-axis to start all readings from the same point (Reading #1).
- Actual Time X-Axis Option: Display readings based on the actual time they occurred for a more chronological view.
Creating a Well Comparison
Step-by-Step Guide
- Navigate to Well Comparison: Go to the analytics menu and select Well Comparison.
- Apply Filters: Use the filters to refine your comparison:
- Lease: Select the lease(s) containing the wells you want to compare.
- Wells: Choose the specific wells you wish to analyze.
- Variables: Select the variables you want to include in the comparison.
- Search: Click Search to create the visuals based on your selected filters and options.
Visualization and Analysis
Graphical Representation
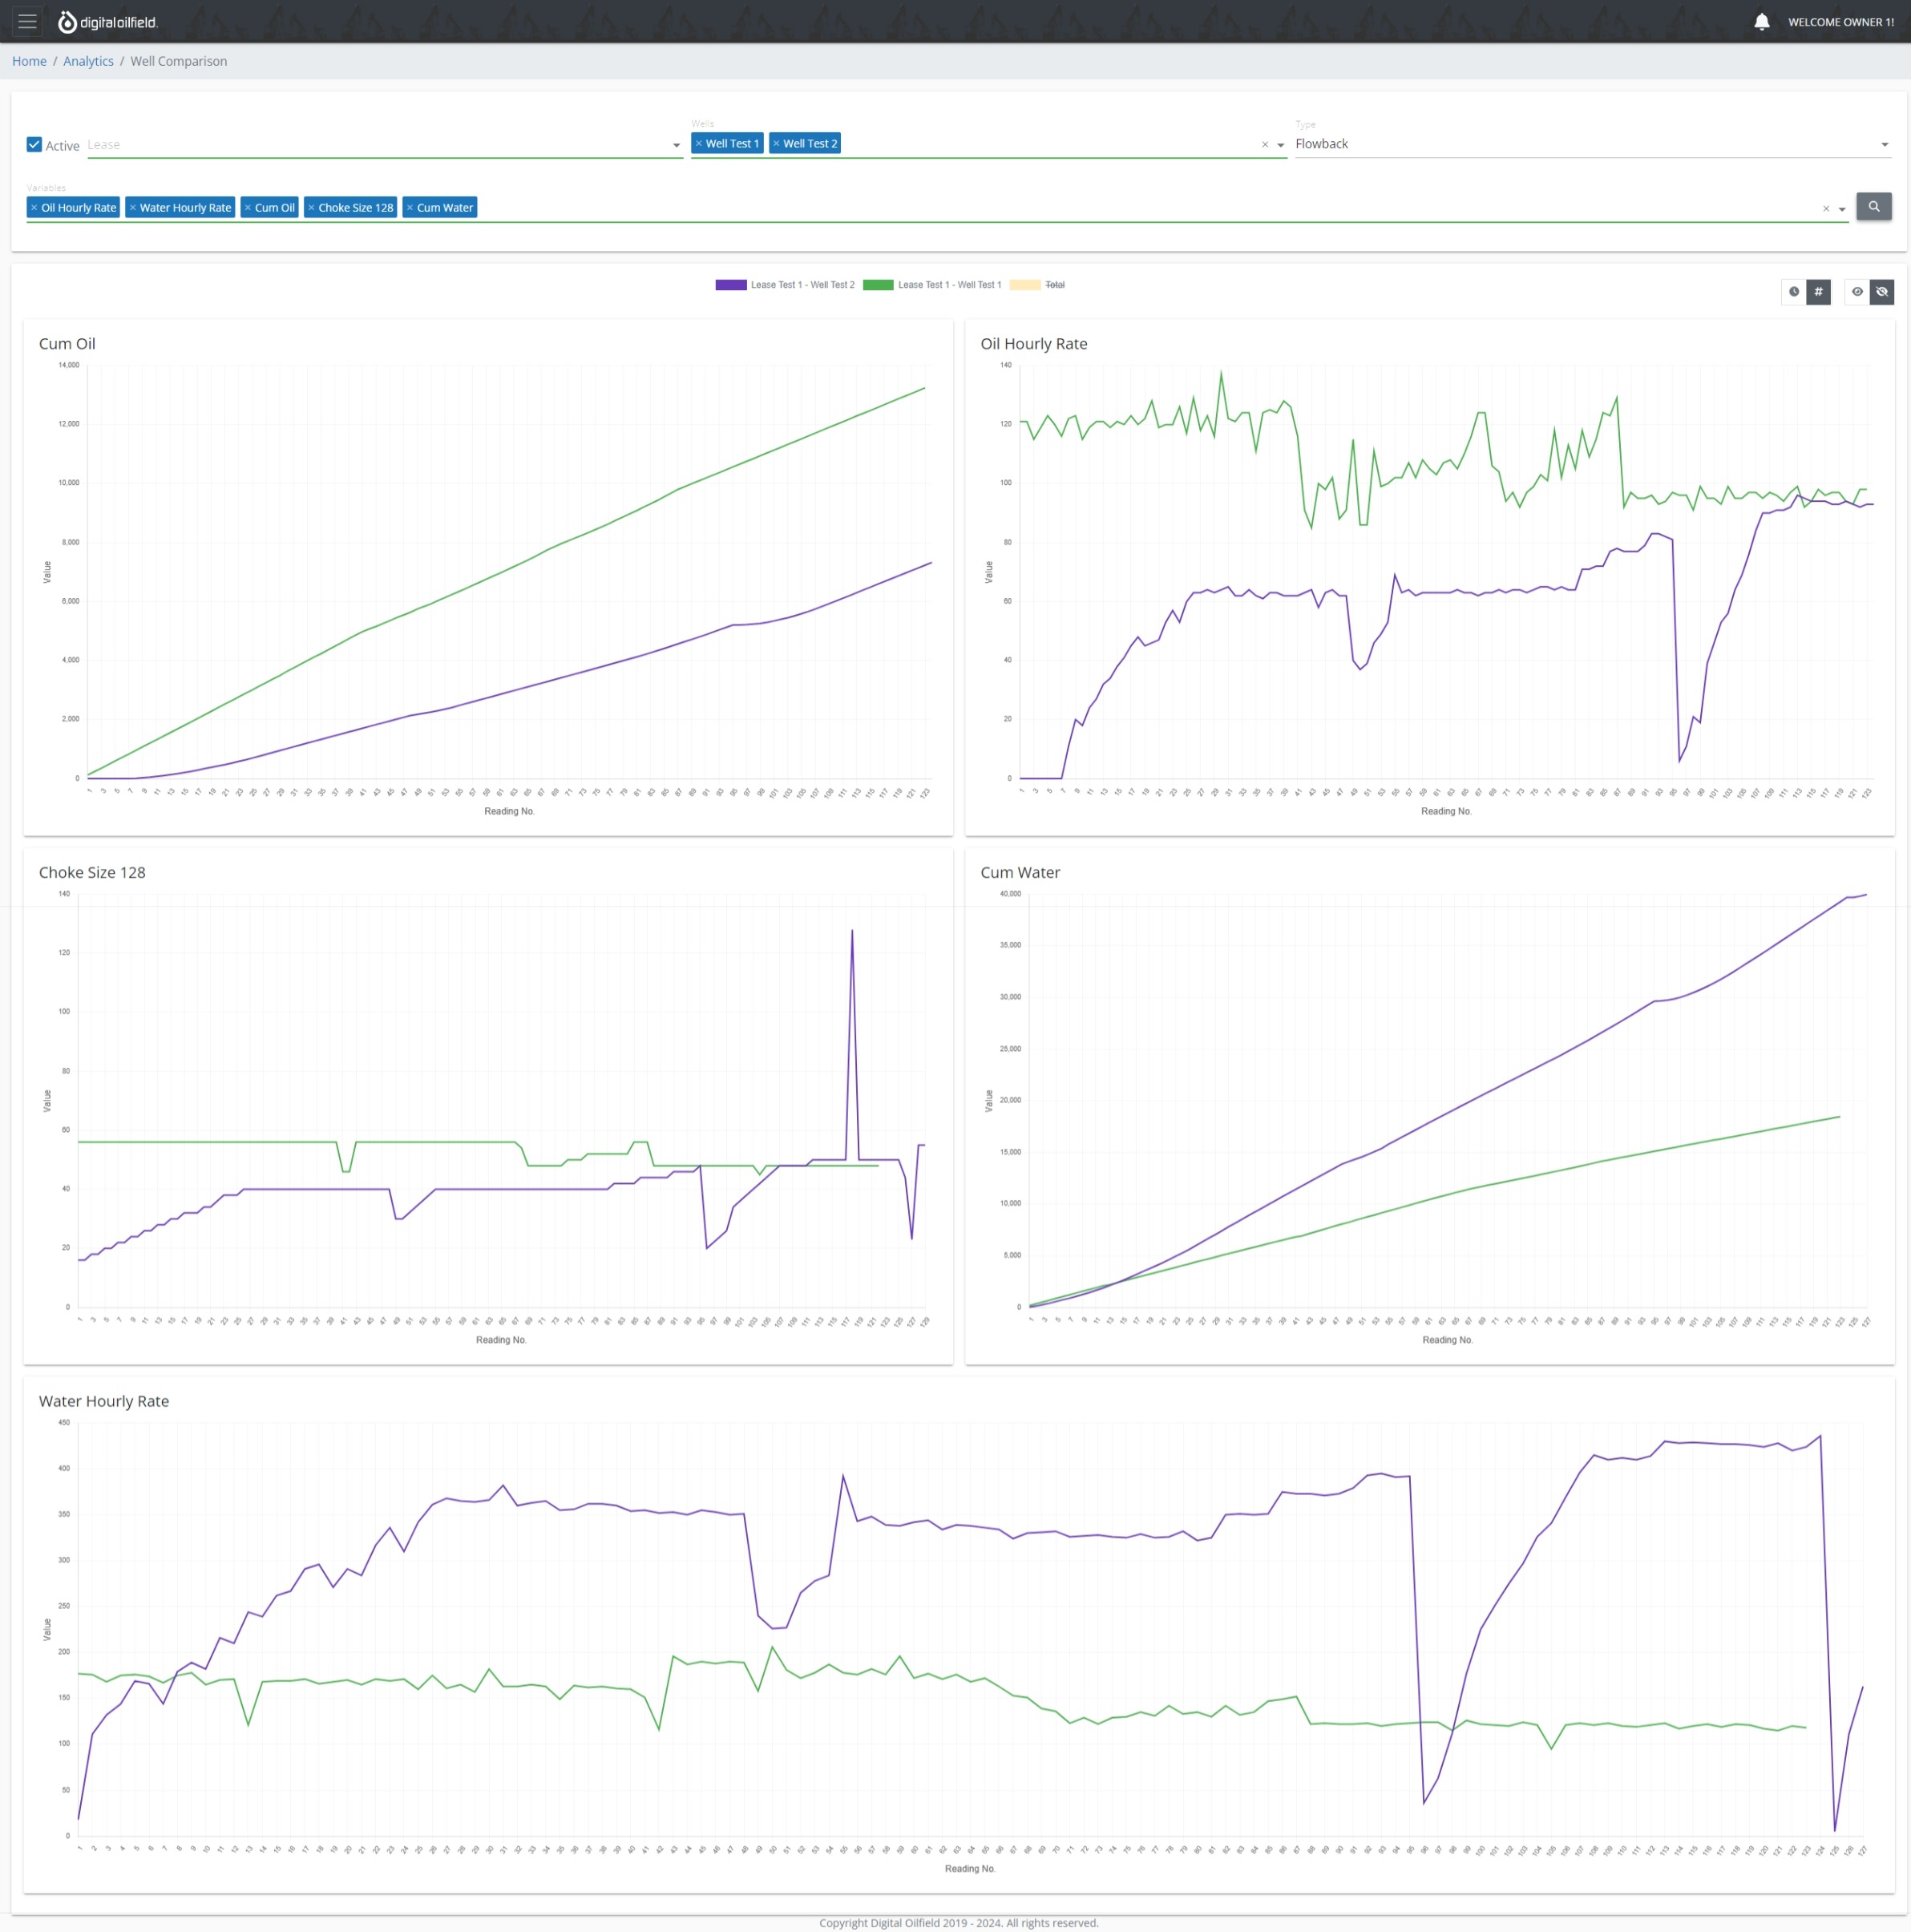
For each selected variable, the visualization engine generates a graph displaying multiple lines, one for each well. This enables users to easily compare and contrast the performance or behavior of different wells for each variable.
Below is an example of a well comparison visualization:
Visualization Options
Choose how you want the data to be displayed:

- Normalized X-Axis: Start all well readings from Reading No. 1 for a standardized comparison.
- Actual Time X-Axis: Display data based on the actual time the readings occurred.