Report
Report
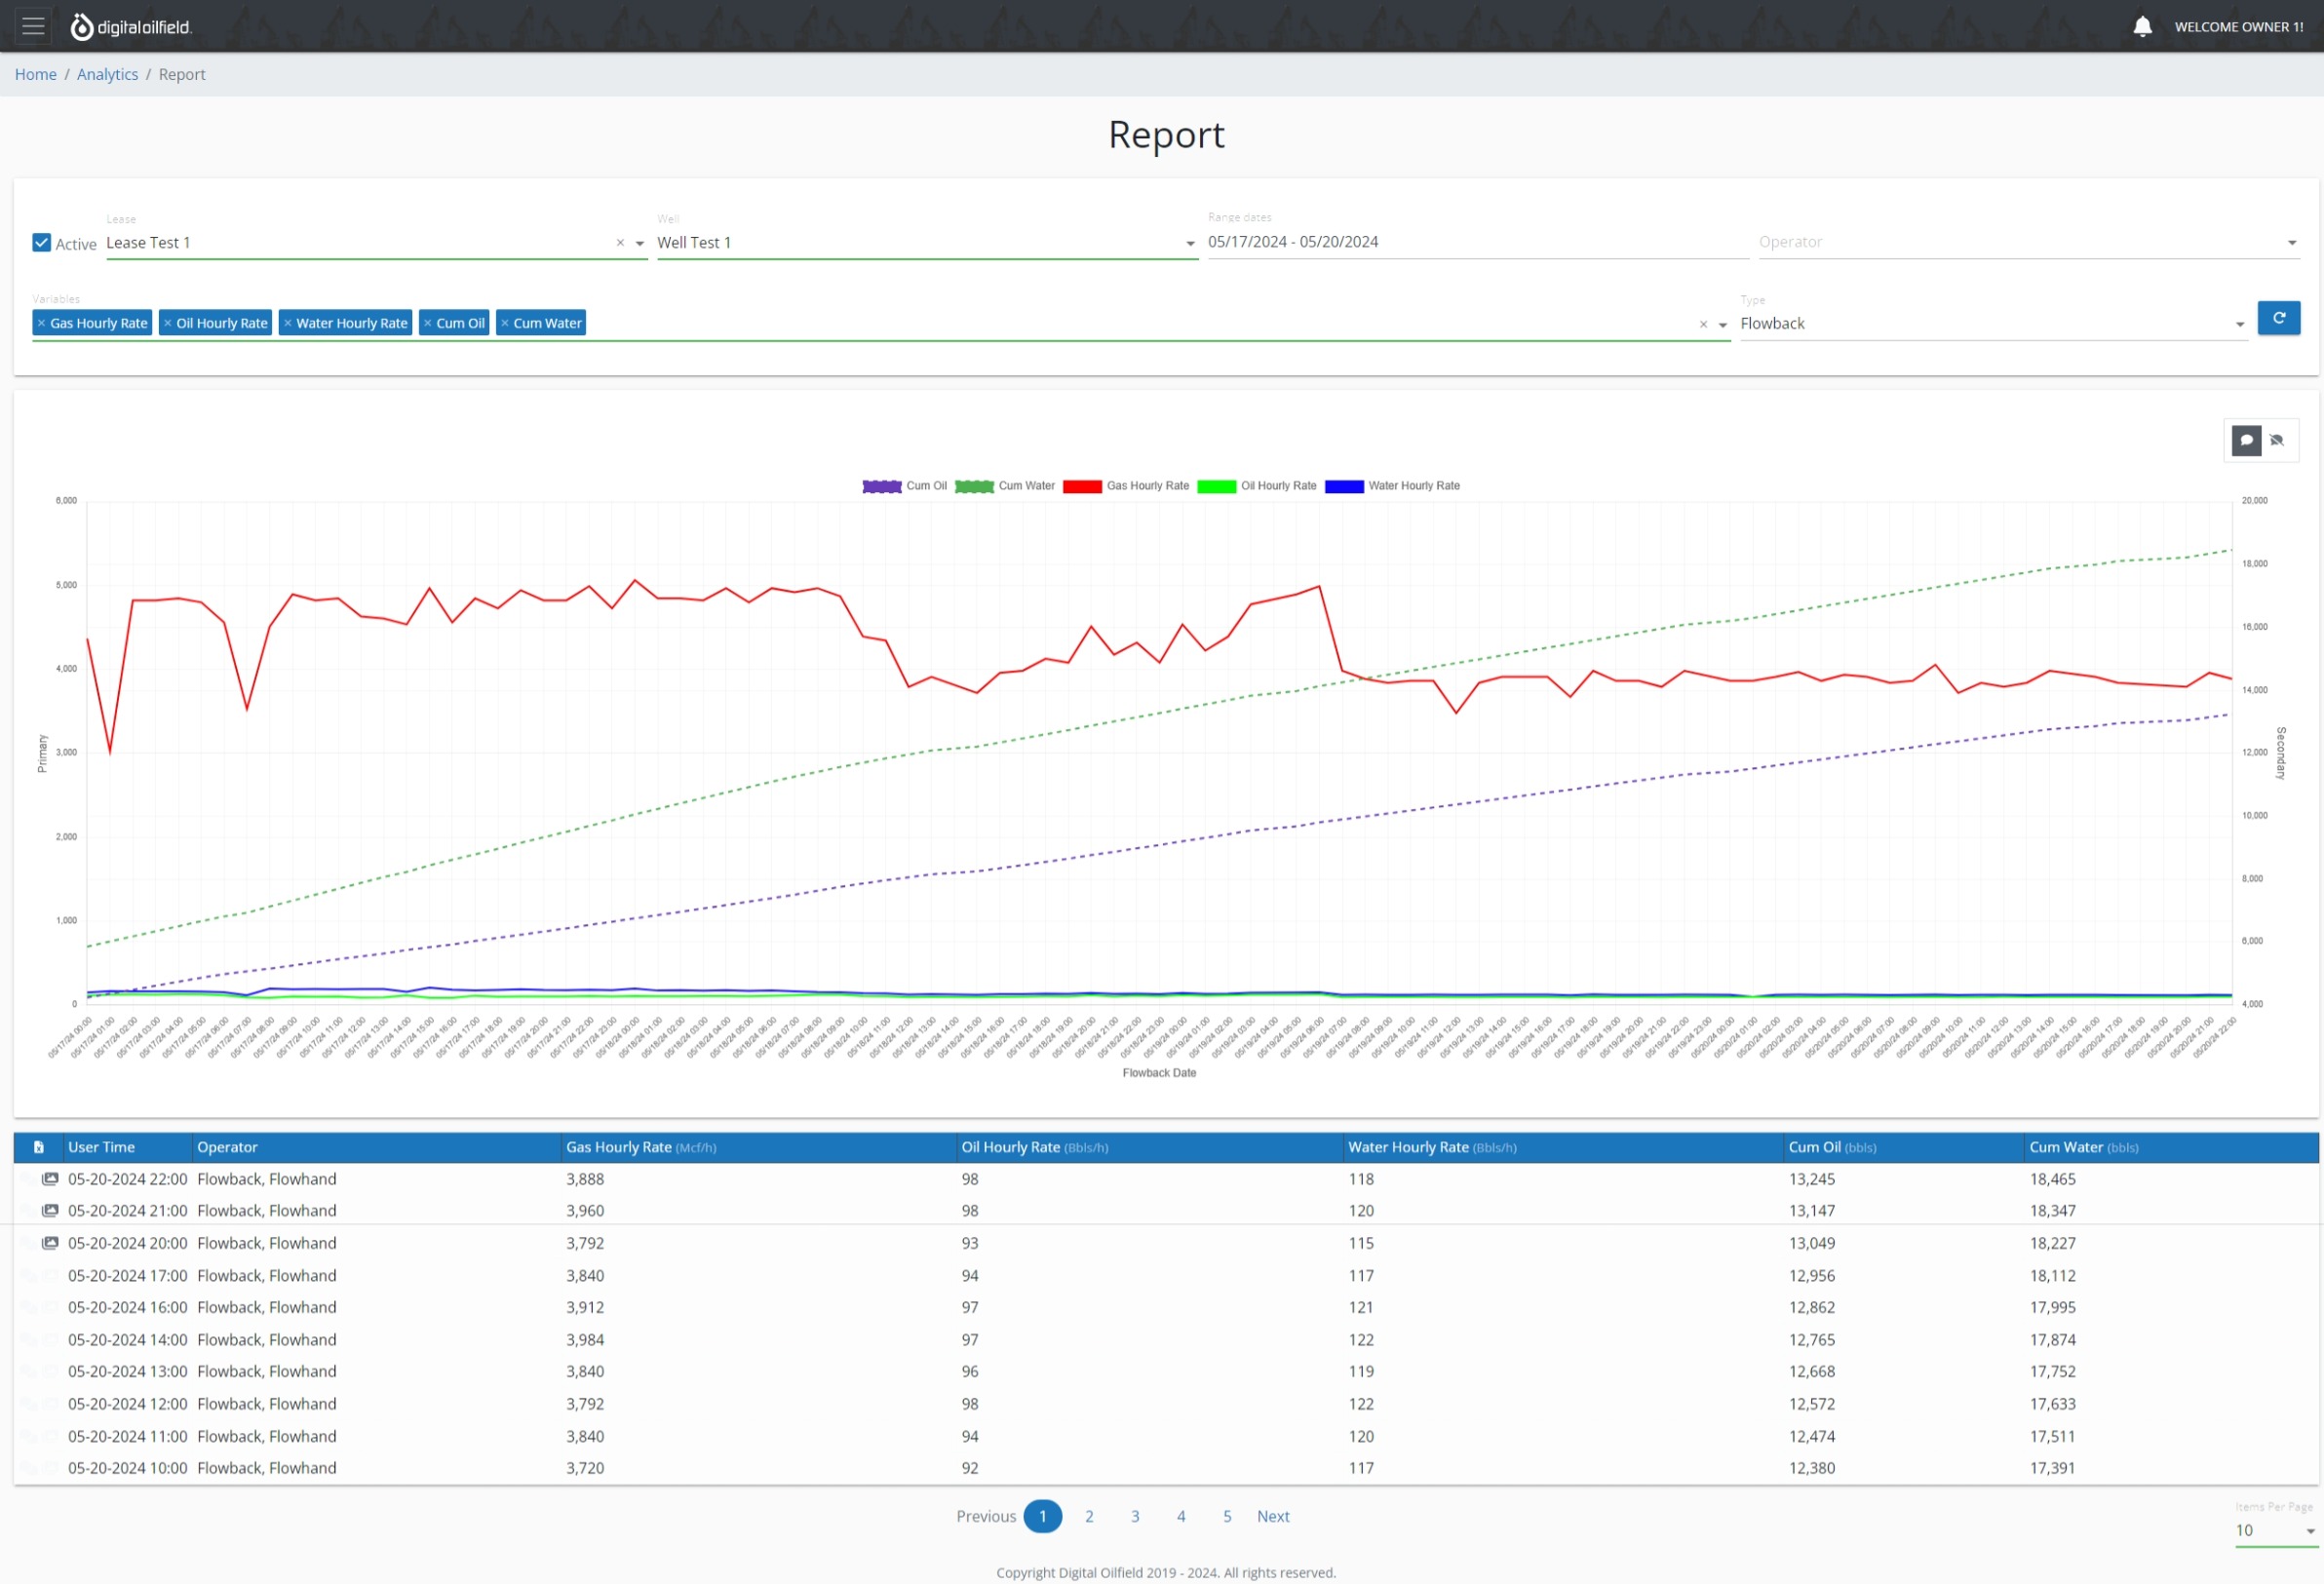
Overview
The Report feature allows you to analyze multiple variables simultaneously for a specific well. This powerful analytics tool provides both graphical and tabular representations of your data, helping you gain deeper insights into your operations.
Key Features
- Multi-Variable Analysis: Analyze multiple variables for a specific well within a single report.
- Graphical Representation: Visualize data trends and patterns through intuitive graphs.
- Tabular Data: Access detailed data in a table format for precise analysis.
- Export Data: Easily export your data for offline analysis or reporting purposes.
Creating a Report
To create a report, follow these steps:
- Navigate to the Report Section: Go to the analytics menu and select Report.
- Apply Filters: Use the required filters to narrow down your data:
- Lease: Select the lease from which the well is located.
- Well: Choose the specific well you want to analyze.
- Dates From and To: Define the date range for the data you wish to analyze.
- Variables: Select the variables you want to include in the report.
- Generate Report: Click on refresh (🔃) to create your report based on the selected filters.
Report Structure
Graphical Representation
The upper section of the report displays a graph with the selected variables. This visual representation helps you quickly identify trends and anomalies.
Tabular Data
The lower section of the report presents a table with detailed data for the selected variables and date range.
- Detailed View: Access precise data points for in-depth analysis, allowing you to scrutinize the specifics of your operational metrics.
- Export Option: Click the Export Data (📄) button located at the top left corner of the table to download the data in CSV format.
Example Report
Below is an example of a typical report layout: